You’ve successfully deployed your new Fabric data solution after weeks of gathering requirements, wrangling data, and designing reports. Scheduled extract, transform and load (ETL) processes run efficiently every hour. Everything appears to be running smoothly, delivering near real-time insights. The stakeholders love their new reports.
But on day two, something changes. Dashboards start to feel sluggish. Then, they stop loading altogether. Frustration mounts. The data team scrambles for answers. These issues never appeared in development or testing—so what happened?
The problem began hours ago, each hourly ETL run is smoothed, spreading its consumption of capacity over 24 hours, gradually pushing consumption higher and higher until throttling thresholds are met, which at first slow down and then block reports loading. Eventually ETL tasks are blocked.
Now, instead of timely, trusted insights, users get… nothing.
Worse still, you identify the cause and stop the ETL tasks from running but the reports are still not loading, in fact they don’t start loading again for hours, why is this? The answer; overages have to be paid back before reports can be run again.
This blog explores Fabric Capacity, the concepts of smoothing, throttling and overages and offers some practical advice about sizing and monitoring your Fabric Capacity. We recommend you read this blog in full, it’s very difficult to understand throttling and overages without a clear understanding of smoothing.
Explaining Capacity Smoothing in Fabric
Fabric categorises operations as either “Background” or “Interactive” and they’re smoothed differently. There are many different operations Fabric supports, a full breakdown can be found here.
The operations we’ll consider in this blog are:
Interactive: Power BI Interactive Query – users running Power BI reports
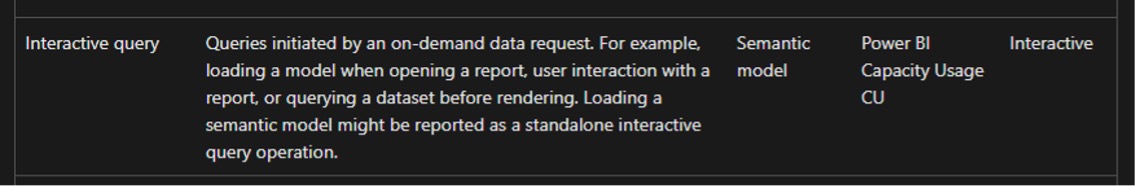
Figure 1
Background: Notebooks and Semantic Model refreshing – ETL activity and updating the semantic model. Note: Both scheduled and on-demand semantic model refreshes are considered Background

Figure 2

Figure 3
So, generally speaking we can consider ETL as background and users running reports as interactive.
What is smoothing?
A Fabric F2 capacity provides 2 Capacity Units (CU). An ETL activity (or job) will consume an amount of capacity unit seconds CU(s) based on the amount of data to process, the complexity of the operations etc. for this example we’ll say our job uses 17,280 CU(s).
The job takes 15 minutes to execute and it’s clear to see that it is using more CU(s) than we have available, 17,280 / 15 minutes / 60 seconds = 19.2 CU, almost 10 times more than the F2 capacity provides.
This is where smoothing comes in, Fabric distributes (smooths) the consumption of Background operations over the next 24 hours so 17,280 CU(s) / 24 Hours / 60 Minutes / 60 Seconds = 0.2 CU or 10% of the F2 capacity
Note: interactive operations are smoothed over a much shorter period of time, often as little as 5 minutes.

Figure 4
Figure 4 illustrates the effect smoothing has on our capacity over time. The hourly ETL process, takes 15 mins to complete and consumes 10% of daily CU(s) each time it runs (orange diamonds), but it is smoothed over 24 hours (blue bars). The yellow bars show the CU consumption each hour of the day.
For example, after the 12:00 run (the 5th run of the day) 50% of the capacity is being consumed. By the end of the day, after 11 runs, 110% of the capacity is being consumed. In this scenario we’ve just executed the ETL over 1 day, so we can see the effect as we start to get beyond 8am on day 2; consumption starts to drop as the early runs on day 1 fall off after 24 hours of smoothing.
Understanding Fabric Throttling
The surprising thing about our smoothing example is that we were able run the last job, taking us over 100% of CU capacity consumption. To understand why that is allowed and what the consequences of this are we need to understand throttling.
Fabric implements 3 levels of throttling, as per the Microsoft documentation.

Figure 5
For now, let’s focus on the last one; Background Rejection. The table in figure 5 tells us that the threshold for Background Rejection is once 24 hours’ worth of future capacity has been consumed.
To understand this, let’s imagine we create an ETL task that can still complete in 15 minutes, but consumes a full 24 hours’ worth of CU(s) and we run it at 8am.
F2 x 60 Seconds x 60 Minutes x 24 Hours = 172,800 CU(s)

Figure 6
As soon as the job runs, 100% of future CU(s) would be consumed and Background Rejection would occur. Because our imaginary ETL task is smoothed over 24 hours, CU consumption will remain at 100% for the next 24 hours. However after one hour, future consumption will be 95.8%, after 6 hours it will be 75%. Therefore the Background Rejection threshold is no longer being reached and new Background tasks are allowed to start.
This means that we can push consumption beyond 100% – we can continue to execute additional jobs so long as we don’t consume more than 24 hours’ worth of future consumption, seems great, right? There’s a catch; we need to consider the other throttling thresholds. Interactive Rejection occurs after just 60 minutes of future capacity is consumed. In our fictitious scenario above, Interactive Rejection would be in place for almost 24 hours until consumption reduces below 100%.
Dealing with Capacity Overages
As we saw in the smoothing section, it is quite easy to consume more than 100% of capacity. When this happens, we’re consuming more capacity than the SKU provides and that has to be paid back (burned down). Let’s switch now from our theoretical examples to look at a real world experiment we carried out.
We’re going to use the Fabric Capacity Metrics App provided by Microsoft. See the link for installation instructions.
On the Compute page, in the top-right there are a selection of charts we can toggle between
Utilisation – Shows the smoothed CU consumption over time
Throttling – Allows us to view the % of each of the throttling thresholds
Overages – Allows a visualisation of the overages and the burn down (explained below)
We created an experiment where we allowed an ETL process to run repeatedly all day and night every 20 minutes. Each run using around 3% of an F2 capacity, so it took around 11 hours to reach 100%. We started around 3:30pm on 26th March, and we hit 100% CU consumption at 2:35am.
The chart in Figure 7 shows percentage consumption of the F2 capacity in 30 second increments, AFTER SMOOTHING in a similar way to the yellow bars in Figure 6:

Figure 7
Let’s look at Background Reject Threshold % in Figure 8 over the same time period, this chart shows the percentage of 24 hours future capacity that has been consumed.
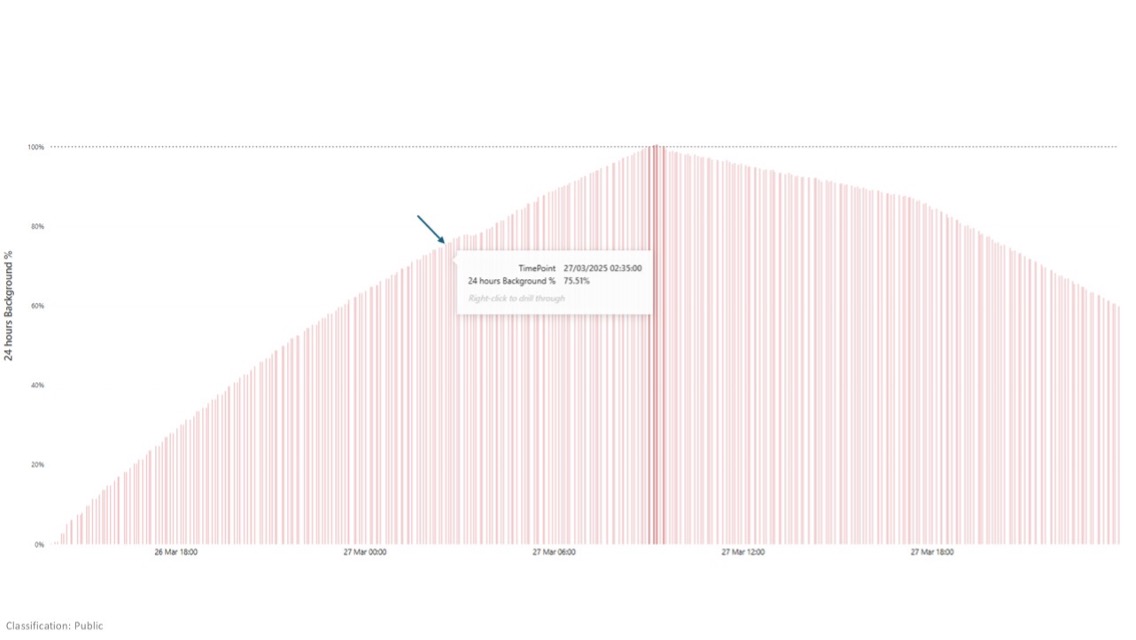
Figure 8
At 2:35am, Background Reject Threshold % was 75.51% therefore the scheduled ETL job was allowed to continue running, resulting in the CU consumption reaching as high as 165%.
Around 9:00am, Background Reject Threshold % reached 100% and we stopped the ETL schedule, simulating that we were reacting to a call from the business complaining their reports had stopped working.
Let’s now review the Overages chart in Figure 9:

Figure 9
First let’s discuss the measures:

Figure 10
- Add is the amount of CU(s) being used over the capacity – whenever the utilisation chart is over 100%, this will be ‘adding’ to the overage
- Burndown is the amount of CU(s) that are being paid back
- Cumulative is showing the total overage which has to be paid back (Burned down)
They’re all expressed as percentages, but percentage of what? Like the utilisation chart, they are showing the percentage of CU(s) capacity consumed AFTER SMOOTHING in 30 seconds increments. An F2 capacity gives us 2 CUs per second, so the capacity is 60 CU(s). While this is somewhat useful for Add & Burndown, the total overage (i.e. how much do we ‘owe’) is expressed on this chart as a cumulative percentage (which should make anyone reading this blog shudder). It would be much clearer to show to the absolute CU(s) value.
We can get that by using the following formula: (Cumulative % / 100) X F2 (Capacity) X 30 Seconds.
In our example, we top out at 96,363%: 963.63 X 2 X 30 = 57,780 CU(s) to be “Burned down”

Figure 11
We can only Burn down CU(s) where we have capacity to do so. In our example, we move from Adding to the overages to Burning Down around 23:00 on 27th March, which can be confirmed on the utilisation chart as when we drop below 100% consumption. Our consumption steadily falls away from there, as the smoothed operations from over 24 hours ago fall off. The amount of Burn Down increases in line with this drop off; as more capacity becomes available more can be paid off.
Impact
What does this all mean for our end users trying to run their reports? Let’s look at the Throttling>Interactive Rejection chart, this shows us when rejection starts and stops, with key timings overlayed.

Figure 12
- At the start of the experiment, consumption steadily climbed while the ETL process was running every 20 minutes
- Several hours later, 100% consumption was reached but, being out of hours, nobody noticed
- At 09:00 the following day, after the business found the reports unresponsive, the ETL was stopped to try to fix the problem
- For the reasons described in this blog, the damage was done; consumption remained over 100% for many hours
- Consumption eventually falls below 100% and the Overage can start being Burned Down, this also takes many hours
- Finally, after almost 1.5 days without reporting, the Overage is Burned Down and reports can be used again
Resolution
In our scenario, we took a simplistic approach to resolving the capacity issues: wait. Alongside waiting, let’s review some alternative suggestions from Microsoft:
Move lower priority or overconsuming workspaces out of the capacity – If you have multiple Fabric capacities this might be a good solution if you have headroom in another capacity.
Upgrade the SKU – In our scenario, changing the SKU from F2 to F4 would have brought the reports back twice as fast, and F8, 4 times as fast etc.
Pause/resume an F capacity – This immediately resets all the metrics we’ve been discussing, bringing the reports back quickly and is probably the approach most teams will take to give the business their reports back. However, it has a catch, as soon as you pause a Fabric capacity all remaining future consumption is calculated and added to your Azure bill. It’s easy to see that if we make a habit of doing this, an F2 SKU could actually cost a lot more than the stated monthly price. https://learn.microsoft.com/en-us/fabric/enterprise/pause-resume Of course, this also fails to address the underlying capacity problem.
Auto scale a P capacity – P capacities have been deprecated. We couldn’t find any plans from Microsoft to introduce autoscaling for F capacities.
Prevention
Avoiding these problems in the first place is always preferable to reacting to them when they do occur.
Monitor Metrics – Both during development/testing and in production. Use insights from this blog and the Fabric Capacity Metrics App to track consumption, throttling, and overages. Early detection helps you adjust workloads before issues occur. Ensure the right-size SKU is selected
Employ Surge Protection – This allows a lower threshold of future consumption to be defined before Background Rejection occurs, maintaining a healthy “head room” for interactive operations. Of course, this does limit the capacity for Background operations – https://learn.microsoft.com/en-us/fabric/enterprise/surge-protection
Optimise Your Fabric Workloads – High consumption can often be resolved by fine-tuning your background workloads and optimising reporting models. Review your data requirements to eliminate unnecessary complexity and adjust processes, ensuring your operations remain efficient while lowering overall capacity demand
How Circyl Can Help
At Circyl, we understand the complexities of managing Fabric Capacity, from smoothing and throttling to resolving costly overages.
Our team can help you proactively manage your Fabric environment, optimise workloads, and implement effective monitoring and surge protection strategies.
Ensure uninterrupted, high-performing data operations with tailored guidance and practical support from Circyl.

Related Reading


Like what you read? Share it!
Get in touch
If you'd like to know more, get in touch using the form below, call 03333 209 969 or email enquiries@circyl.co.uk.